Beyond traditional PDF parsing
How I turn PDF pages into images, extract Markdown with a multimodal LLM, and prepare it for search in my demo app.
Listen · ElevenLabs narration
On this page
While working on PDF ingestion, I kept running into a gap between extracting text and recovering usable data. A parser could return the numbers from a table, yet I still had to work out which year, category, or footnote each number belonged to.
That led me to try rendering a page as an image and giving it to a vision-capable model. The useful discovery was that the page layout could become part of the input: column positions, section bands, and footnote markers could help the model reconstruct the table.
For the layout-heavy documents I was working with, that was the advantage: I could ask for the relationships between elements while the model still had the whole page in view. Here is the discovery, the extraction prompt I used, and the PDF-to-images-to-Markdown pipeline I use in my demo app.
Where text extraction loses context
A PDF can position text so it looks like a table without storing explicit relationships between its cells. Extracting the characters does not automatically recover those relationships, as the pypdf documentation explains.
OCR adds the ability to recognize text in scans. A multimodal LLM can also interpret the visual relationships around that text: which heading governs a group of rows, where a footnote applies, and how a caption relates to a figure. That is the capability I wanted to use. Rendering the page preserves those cues as input.
A table that makes the problem visible
This page from San Diego County's 2024 respiratory surveillance report has three sections, three numeric columns, and four footnotes. The same disease names recur under cases, deaths, and outbreaks.
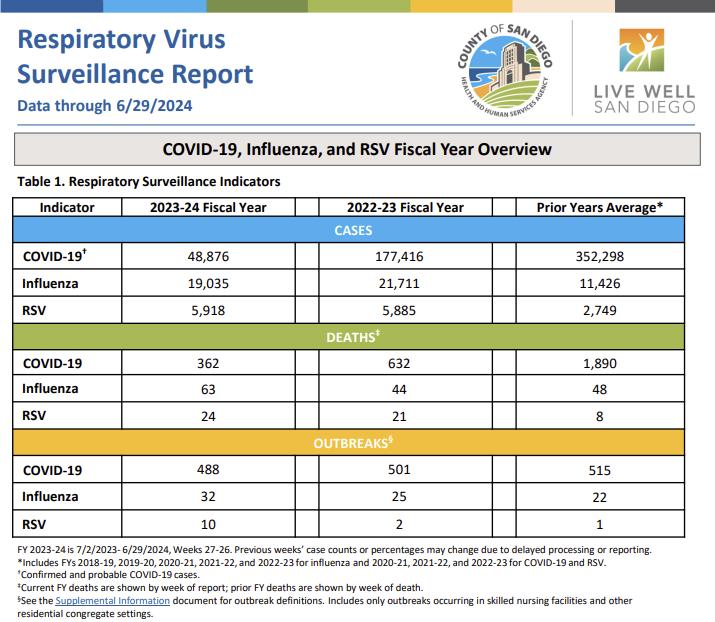
Source: County of San Diego, Respiratory Virus Surveillance Report, data through June 29, 2024.
The text representation
Here is an illustrative JSON serialization of a page document in the style returned by PyPDFLoader. The text is in page_content, alongside source metadata. This simplified example uses a zero-based page index, so page: 1 refers to the second page. The exact text order depends on the PDF and extraction settings.
{
  "page_content": "Respiratory Virus Surveillance Report\nData through 6/29/2024\nCOVID-19, Influenza, and RSV Fiscal Year Overview\nTable 1. Respiratory Surveillance Indicators\nIndicator 2023-24 Fiscal Year 2022-23 Fiscal Year Prior Years Average*\nCASES\nCOVID-19† 48,876 177,416 352,298\nInfluenza 19,035 21,711 11,426\nRSV 5,918 5,885 2,749\nDEATHS‡\nCOVID-19 362 632 1,890\nInfluenza 63 44 48\nRSV 24 21 8\nOUTBREAKS§\nCOVID-19 488 501 515\nInfluenza 32 25 22\nRSV 10 2 1\nFY 2023-24 is 7/2/2023 - 6/29/2024, Weeks 27-26. Previous weeks' case counts or percentages may change due to delayed processing or reporting.\n*Includes FYs 2018-19, 2019-20, 2020-21, 2021-22, and 2022-23 for influenza and 2020-21, 2021-22, and 2022-23 for COVID-19 and RSV.\n†Confirmed and probable COVID-19 cases.\n‡Current FY deaths are shown by week of report; prior FY deaths are shown by week of death.\n§See the Supplemental Information document for outbreak definitions. Includes only outbreaks occurring in skilled nursing facilities and other residential congregate settings.",
  "metadata": {
    "source": "SDC-20Annual--2023-24-Respiratory-Surveillance.pdf",
    "page": 1
  }
}
The values and footnotes are still present, but the table has become a text stream. A downstream step must work out which numbers belong to which fiscal year, distinguish cases from deaths and outbreaks, and connect each footnote to the correct heading or indicator. This example illustrates the extra interpretation required; it does not establish that a particular parser would lose or misalign data on this page.
The Markdown representation
I wanted the image extraction to keep those relationships explicit. My original prompt, included below, requests Markdown for vector search. This reconstructed example uses headings for the report and its sections, Markdown tables for the values, and the original footnote markers to keep the qualifications attached to the data. Counts and dates stay in the form shown on the page.
# Respiratory Virus Surveillance Report

County of San Diego

Data through 6/29/2024

## COVID-19, Influenza, and RSV Fiscal Year Overview

### Table 1. Respiratory Surveillance Indicators

#### CASES

| Indicator | 2023-24 Fiscal Year | 2022-23 Fiscal Year | Prior Years Average\* |
| --- | ---: | ---: | ---: |
| COVID-19† | 48,876 | 177,416 | 352,298 |
| Influenza | 19,035 | 21,711 | 11,426 |
| RSV | 5,918 | 5,885 | 2,749 |

#### DEATHS‡

| Indicator | 2023-24 Fiscal Year | 2022-23 Fiscal Year | Prior Years Average\* |
| --- | ---: | ---: | ---: |
| COVID-19 | 362 | 632 | 1,890 |
| Influenza | 63 | 44 | 48 |
| RSV | 24 | 21 | 8 |

#### OUTBREAKS§

| Indicator | 2023-24 Fiscal Year | 2022-23 Fiscal Year | Prior Years Average\* |
| --- | ---: | ---: | ---: |
| COVID-19 | 488 | 501 | 515 |
| Influenza | 32 | 25 | 22 |
| RSV | 10 | 2 | 1 |

FY 2023-24 is 7/2/2023 - 6/29/2024, Weeks 27-26.

Previous weeks' case counts or percentages may change due to delayed processing or reporting.

\* Includes FYs 2018-19, 2019-20, 2020-21, 2021-22, and 2022-23 for influenza and 2020-21, 2021-22, and 2022-23 for COVID-19 and RSV.

† Confirmed and probable COVID-19 cases.

‡ Current FY deaths are shown by week of report; prior FY deaths are shown by week of death.

§ See the Supplemental Information document for outbreak definitions. Includes only outbreaks occurring in skilled nursing facilities and other residential congregate settings.
The structure gives each part of the page a place:
- Preserves the table's sections for cases, deaths, and outbreaks
- Keeps all 27 counts aligned with their fiscal-year columns
- Captures the reporting period and the caveat about delayed reporting
- Retains the different prior-year averaging periods in the footnotes
- Associates the symbols (*, †, ‡, §) with their corresponding notes
This is the representation I wanted to recover. It also gives me something specific to check: the values, their column assignments, and the notes that qualify them.
What I took from the comparison
The useful unit of data is a value together with its context. In this table, 362 belongs to COVID-19 deaths in fiscal year 2023–24. The deaths footnote says the current fiscal year is reported by week of report, while earlier years use week of death. Keeping the number but losing that note changes how it should be interpreted.
Multimodal extraction has a clear advantage over a flattened text stream here: the model can inspect the table and its notes together, then express their relationships in the structure I request. It gives me a way to handle changing layouts without writing a separate set of positioning rules for each report. The reconstructed examples illustrate that structure; they do not establish a measured accuracy improvement.
The extraction prompt I used
This is the prompt I used to extract content from PDF page images. It worked especially well for the documents I was processing, producing Markdown for vector search. The table and numerical-data instructions spell out the relationships I wanted to preserve: which heading a value belongs to, which time period it describes, and which footnotes qualify it.
Send the full system prompt as the model's system instructions, then attach one rendered page image to the user message below. I have kept the original wording here.
System prompt
<instructions>
- You are an AI that processes images extracted from PDF documents, converting visual content into text format suitable for vector searching.
- Focus on accuracy and maintaining the semantic structure of the original content.
- Optimize output for text-based vector searching.
- Process all visible information in the image.
- If space constraints arise, prioritize in this order: main text, tables/charts, supplementary text, decorative elements.
- End your output with the last piece of information from the document, without any concluding remarks or summaries.
</instructions>
<rules>
- Organize content using markdown headings to separate different sections or elements.
- Present information in the order it appears in the image, maintaining the original structure.
- Do not include any overview, summary, or description of visual elements at the beginning or end of your output.
- Transcribe all visible text accurately.
- Maintain original formatting and structure where possible.
- Note if text is handwritten and provide interpretation.
- For illegible text, indicate [illegible] and describe the apparent content if possible.
- Convert charts, tables, and graphs to markdown tables.
- Include column headers and row labels.
- Make approximations for data points that are not clearly labeled when necessary.
- For complex visuals, provide a textual representation of the data, using approximations where necessary.
- Preserve the overall structure and relationships within the data.
- Describe non-text elements concisely but comprehensively within the context of where they appear in the document.
- Include subject matter, colors, visual style, spatial relationships, and notable features in image descriptions.
- Do not create a separate section for image descriptions.
- Note page numbers, section headers, or document titles as they appear.
- Identify document type if apparent.
- Preserve the context and relationship between different elements in the image.
</rules>
<formatting>
- Use markdown syntax for formatting.
- For mathematical equations, use LaTeX notation if complex.
- Use markdown tables for charts, tables, and graphs.
- Maintain the original document structure using appropriate markdown headings.
</formatting>
<structured_content>
- Identify and preserve hierarchical structures using nested markdown headers (# ## ### ####).
- For repeating information patterns, consistently extract and format data:
  Name: [Name]
  Title: [Title]
  Contact: [Contact Info]
  Additional Info: [Any other relevant details]
- Pay attention to visual cues (indentation, box sizes, connecting lines, spatial relationships) to understand and represent relationships between elements.
- Use markdown tables for grid or table-like information. For complex tables, represent as best as possible and explain any structural complexities.
- Maintain consistent patterns of information throughout the document. Use [Not provided] for missing data to maintain structure.
- For organizational charts or similar hierarchical structures:
  - Start with the top position and work down, preserving reporting relationships.
  - Use consistent indentation or markdown headers to show hierarchy levels.
  - Include all visible positions, even if some information is missing.
</structured_content>
<table_detection>
- Explicitly identify table boundaries with column and row demarcations
- Maintain alignment relationships between headers and data cells
- Preserve the hierarchical structure of multi-level headers
- Ensure numerical data is recognized as such and not as text strings
- Map related columns within complex tables (e.g., match "Week 31" with its corresponding data)
</table_detection>
<numerical_data>
- Prioritize extraction of numerical statistics, especially totals and sums
- Recognize and preserve relationships between headers and their corresponding values
- Maintain distinction between different measurement periods (weekly vs. yearly totals)
- Identify and properly extract fiscal year totals as separate from intermediate calculations
- Tag numerical data with appropriate units or categories (cases, deaths, percentages)
</numerical_data>
<health_data_specific>
- Recognize standard epidemiological report formats
- Identify disease categories and their corresponding metrics
- Prioritize extraction of key public health statistics (cases, hospitalizations, deaths)
- Maintain relationships between disease names and their statistical data
- Preserve time period information associated with each data point
</health_data_specific>
<data_verification>
- Cross-reference figures across related sections
- Verify that row and column totals match their components when present
- Flag potentially incomplete data extraction for human review
- Maintain numerical precision without rounding
- Preserve footnotes and annotations that explain data limitations
</data_verification>
User prompt
Extract and transcribe the content from this document page image.For other document types, replace the health_data_specific section with the categories, units, and relationships that matter for your material. Keep the instructions about table headers, time periods, numerical precision, and footnotes when they apply.
One change I would make for exact data extraction is to remove the two rules that allow approximations. Replace them with: "Do not estimate unlabeled data points or unreadable values. Mark them as [unlabeled] or [illegible], preserve their surrounding context, and flag them for review." If chart estimates are useful to your application, label and store them separately from transcribed values.
The original prompt above is also the default in my demo app's vision extractor. The pipeline below shows how I render each page, prepare the model input, and turn the resulting Markdown into searchable chunks. The prompt's verification instructions are a useful first pass; I would still compare the extracted values and relationships against the page.
The pipeline I use in my demo app
In my demo app, I use a Node.js/TypeScript pipeline with two parts: packages/pdf-tools renders PDF pages and extracts Markdown, while apps/web/src/lib/ingestion coordinates extraction, chunking, embeddings, and storage.
The rendered page passes through vision extraction, then its Markdown becomes searchable chunks. Page and document identifiers travel with the content into Qdrant.
PDF → images → Markdown → chunks → search indexSelect a stage to explore it, or play the full flow.
Retry by page. Failed page numbers can be selected for rerendering and extraction without repeating the full PDF.
The original prompt above is the default system prompt in this implementation. The Markdown example above follows the same output format as my demo app's extraction stage.
1. Render the PDF into PNG pages
I use unpdf and its renderPageAsImage() function. In my implementation, pdfjs-dist supplies the legacy PDF.js build, and @napi-rs/canvas supplies the Node.js canvas implementation.
The excerpts below are from the rendering and extraction stages, with setup condensed for readability. They use unpdf 1.4, PDF.js 5.4, @napi-rs/canvas 0.1, and AI SDK 6. The ingestion job supplies filePath and outputDir.
import * as fs from 'node:fs/promises';
import * as path from 'node:path';
import {
  definePDFJSModule,
  getDocumentProxy,
  renderPageAsImage,
} from 'unpdf';

// Install the canvas DOMMatrix before initializing PDF.js.
if (typeof globalThis.DOMMatrix === 'undefined') {
  const { DOMMatrix } = await import('@napi-rs/canvas');
  (globalThis as Record<string, unknown>).DOMMatrix = DOMMatrix;
}

await definePDFJSModule(
  () => import('pdfjs-dist/legacy/build/pdf.mjs')
);

const pdfData = new Uint8Array(await fs.readFile(filePath));
const pdf = await getDocumentProxy(pdfData);
const scale = 2.0;
const renderedPages = [];
await fs.mkdir(outputDir, { recursive: true });

for (let pageNum = 1; pageNum <= pdf.numPages; pageNum++) {
  const page = await pdf.getPage(pageNum);
  const imageData = await renderPageAsImage(pdf, pageNum, {
    scale,
    canvasImport: () => import('@napi-rs/canvas'),
  });

  const imageBuffer = Buffer.from(imageData);
  const filename = `page-${String(pageNum).padStart(3, '0')}.png`;
  const imagePath = path.join(outputDir, filename);
  await fs.writeFile(imagePath, imageBuffer);

  renderedPages.push({ pageNumber: pageNum, imagePath, imageBuffer });
  page.cleanup();
}
In the app, PDF.js initialization is guarded so it runs once. The PDF bytes are passed as a true Uint8Array, which matters for this version of unpdf. Pages are numbered from one and saved as page-001.png, page-002.png, and so on. These are temporary files; the ingestion job removes its working directory when it finishes.
The renderer currently returns an array containing every rendered page's image buffer. That is convenient for the next stage, but memory use grows with the document. For large PDFs, I would render, extract, and release a bounded group of pages at a time.
2. Resize the image sent to the model
Before vision extraction, I resize each image so its longest side is at most 1,024 pixels, preserving its aspect ratio. Images already within that limit stay unchanged. This happens in memory; the saved PNG retains its original 2× render size.
The resizing helper in vision-extractor.ts uses the same canvas dependency:
async function resizeImageBuffer(
  imageBuffer: Buffer,
  maxDimension = 1024
): Promise<Buffer> {
  const { createCanvas, loadImage } = await import('@napi-rs/canvas');
  const image = await loadImage(imageBuffer);
  const { width, height } = image;

  if (width <= maxDimension && height <= maxDimension) {
    return imageBuffer;
  }

  const scale = maxDimension / Math.max(width, height);
  const newWidth = Math.round(width * scale);
  const newHeight = Math.round(height * scale);
  const canvas = createCanvas(newWidth, newHeight);
  const ctx = canvas.getContext('2d');
  ctx.drawImage(image, 0, 0, newWidth, newHeight);

  return canvas.toBuffer('image/png');
}
I use the cap to accommodate image-size constraints in the local-model path. It is a setting to test against your documents: small footnotes or dense tables can become harder to read after downscaling. Inspect the resized image the model actually receives. If necessary, raise the limit for a model that supports it, or supply detailed crops alongside the full page. Increasing the render scale alone will not bypass the later 1,024-pixel cap.
3. Send the page with the extraction prompt
The extraction function uses AI SDK's generateText(). It sends the system prompt above, the short user prompt, and the resized image encoded as base64:
import { generateText } from 'ai';

const resizedBuffer = await resizeImageBuffer(imageBuffer);
const base64Image = resizedBuffer.toString('base64');

const result = await generateText({
  model,
  messages: [
    { role: 'system', content: systemPrompt },
    {
      role: 'user',
      content: [
        { type: 'text', text: userPrompt },
        { type: 'image', image: base64Image },
      ],
    },
  ],
});

const markdown = result.text.trim();
Here, imageBuffer is one rendered page, and systemPrompt and userPrompt are the two prompts above. In my demo app, model comes from my getVisionModel() provider factory or a model passed to the extraction function. The factory supports Ollama and OpenRouter. In your own application, supply a vision-capable model instance from your AI SDK provider and configure that provider's credentials or local endpoint. The renderer and resizing code can stay the same when you change models.
The wrapper adds an HTML comment containing the page number and optional document title, then collects successful results in a Map<number, string>. The ingestion layer groups pages in sets of ten, but the extraction loop awaits each page sequentially. These groups are for application processing and progress reporting; they do not use a provider's discounted Batch API.
If a page throws an extraction error, the batch helper records its number in failedPages and continues with the remaining pages. A separate retryPages() path renders and processes only the selected pages. I would also check for empty or truncated responses before accepting a page: the current extraction helper returns trimmed text without checking the model's finish reason.
4. Chunk the Markdown and keep its source context
After extraction, chunkMultiPageMarkdown() splits each page at level-two and level-three Markdown headings. It targets roughly 1,000 tokens per chunk, using four characters per token as an estimate. Larger sections are split further, and small adjacent chunks can be combined when they belong to the same page. This is a text-length heuristic, so I would check how it handles large tables and their footnotes before relying on the chunks.
Each chunk retains its page number and chunk index. The ingestion layer generates embeddings in groups of 50, adds a sparse text vector for hybrid retrieval, and stores the vectors and chunk text in Qdrant, together with document and project identifiers. That gives a retrieved passage a path back to its source page.
For your own implementation, get the page-to-Markdown stage working on a few representative documents first. Compare each result with its image, then inspect the chunks before adding embeddings and storage. For the surveillance page, I would check all three sections, nine disease rows, 27 values, four footnotes, and the reporting dates. A number copied into the wrong year is still wrong even if the Markdown looks tidy.
My demo app currently sends successful extractions directly into chunking and indexing. If your workflow requires reviewed data, add a review step before indexing. A completed model call does not establish that every value was extracted correctly, and failedPages only captures errors the extraction loop catches.
If you need typed JSON for calculations, adapt the extraction prompt to a schema and validate the result before using it. Replace the Markdown-formatting instructions rather than asking for both formats in the same response. For retrieval, Markdown keeps headings, prose, and tables together in a form that is easy to inspect.
5. Choose the model for visual reasoning and cost
I would shortlist models with strong MMMU-Pro results and low image-input and output prices. MMMU-Pro tests reasoning that depends on visual information, making it a useful selection signal. It is broader than document extraction, so I would then compare candidates on my own tables, notes, and small print at the actual image size used by the pipeline.
A concrete budget candidate is Gemini 3.1 Flash-Lite. Google's model card reports 76.8% on MMMU-Pro. Its evaluation methodology identifies the March 2026 preview with high thinking and an average of the Standard and Vision settings. That published score is a candidate-selection signal, rather than a measurement of my demo app's extraction accuracy. My demo app's model is configurable; this recommendation does not describe a fixed model in the pipeline.
As checked on October 11, 2026, standard Gemini API pricing is $0.25 per million text/image input tokens and $1.50 per million output tokens, including thinking. Batch rates are $0.125 and $0.75 respectively. Those are direct Gemini API rates; check the price and supported settings on the provider you actually use. Image processing, output length, reasoning, and retries all affect the cost per page.
To measure that cost in this pipeline, retain usage metadata from generateText() alongside the page identifier; the current extraction helper only returns the text. Track retries and review time as well as token charges. Start with an inexpensive model, inspect the results, and route difficult pages to a stronger model or a higher-resolution input when needed. The useful measure is the cost of a page whose content and relationships you can trust.
Where OCR services still fit
For general OCR and established document workflows, these are useful services to consider:
- Amazon Textract extracts printed or handwritten text, forms, and tables.
- Azure Document Intelligence extracts layout and table structure, including rows, columns, and merged cells.
- Google Document AI Enterprise OCR provides document text recognition and layout information for downstream processing.
These services already do more than return a bag of words. The advantage I am highlighting is the multimodal LLM's flexible interpretation of a whole page and its ability to map that interpretation into a schema I define. That is particularly useful when the relationship between a table, its heading, and its notes matters, or when report layouts vary.
For those documents, I would build around page images and multimodal extraction. Keep OCR services in the toolkit for transcription and established forms, and judge the image pipeline by whether it preserves the relationships your application needs.